Data analysis techniques for drone-collected agricultural images are revolutionizing crop management. Drones equipped with high-resolution cameras provide detailed visual data of fields, enabling farmers and researchers to monitor crop health, predict yields, and optimize resource allocation. This detailed information, derived from diverse image formats, offers insights previously unavailable, leading to more sustainable and efficient agricultural practices.
This analysis explores various techniques, from image preprocessing and feature extraction to sophisticated machine learning models like supervised and unsupervised learning, and even deep learning. Each method offers unique advantages in understanding crop conditions and predicting outcomes. The integration of drone imagery with other agricultural data sources, such as weather and soil data, enhances the comprehensiveness of analysis, leading to more accurate and actionable insights.
Introduction to Drone Imagery in Agriculture
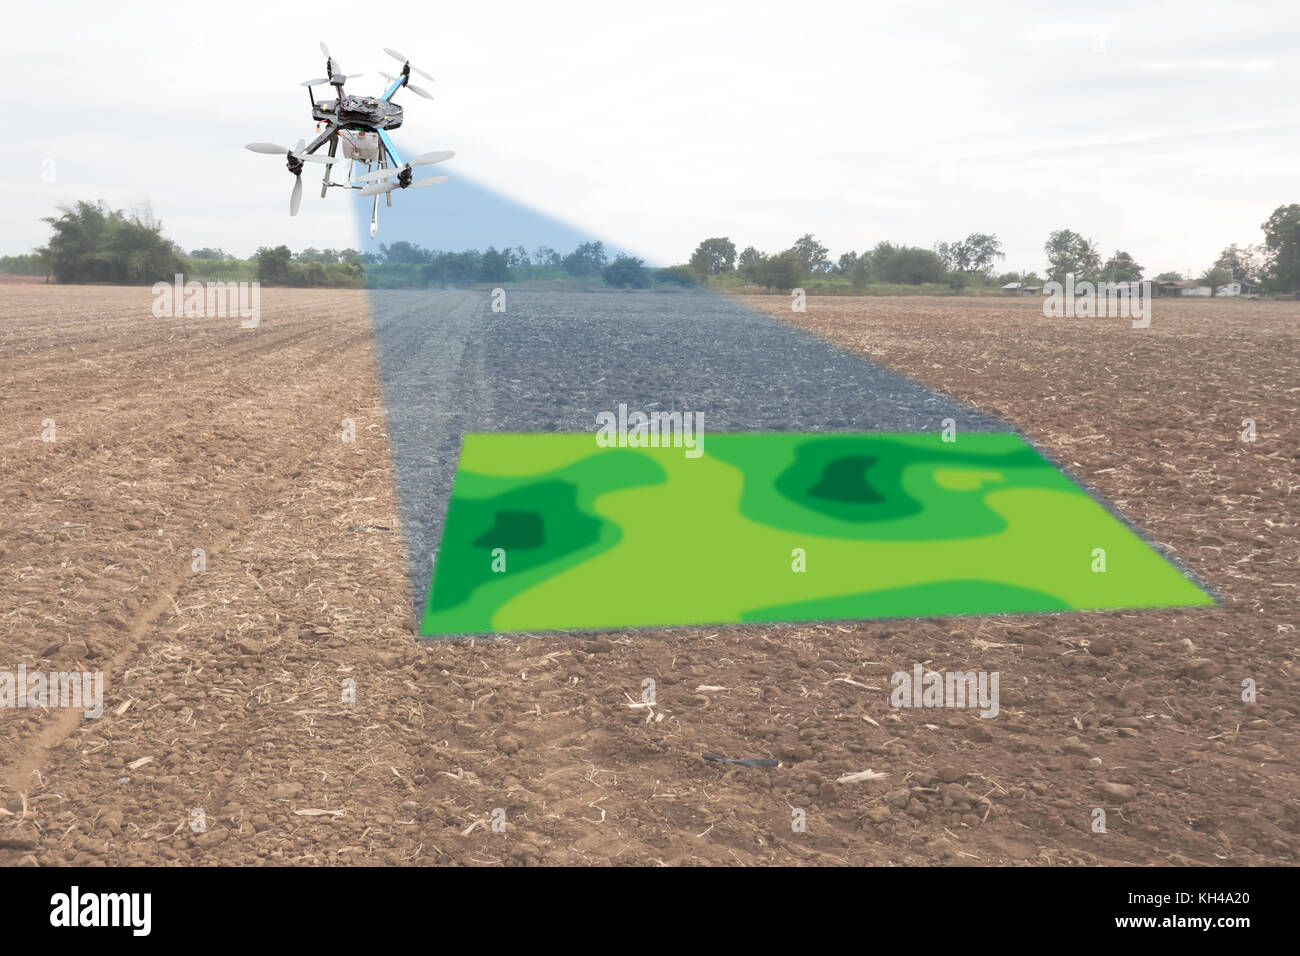
Unmanned aerial vehicles (UAVs), commonly known as drones, are rapidly transforming agricultural practices worldwide. Their ability to capture high-resolution imagery from the air provides invaluable data for assessing crop health, identifying potential issues, and optimizing resource allocation. This detailed analysis explores the role of drone imagery in modern agriculture, examining the types of data collected, the image formats used, and their practical applications.Drones equipped with advanced sensors offer a unique perspective on agricultural landscapes, enabling farmers to monitor their fields with unprecedented precision.
This aerial perspective facilitates early detection of disease outbreaks, nutrient deficiencies, and other stressors that can impact crop yield and quality. This data-driven approach promises to revolutionize agricultural decision-making, allowing for more targeted interventions and ultimately enhancing efficiency and sustainability.
Drone-Collected Data for Crop Health Assessment
Drones collect a wide array of data crucial for understanding crop health. This includes visible light imagery, which reveals the visible characteristics of plants, such as color, texture, and overall appearance. Near-infrared (NIR) imagery, on the other hand, penetrates the canopy to capture information about plant structure and chlorophyll content, providing valuable insights into the physiological state of the crops.
Thermal imagery identifies areas of unusual heat signatures, potentially indicating issues like water stress or pest infestations.
Image Formats for Agricultural Drone Data
Various image formats are commonly used to store and manage drone-collected agricultural data. These formats range from simple JPEG images for basic visual assessments to more sophisticated georeferenced raster data like GeoTIFF. Georeferenced data, which links the image coordinates to a specific location on the ground, is essential for accurate analysis and mapping. High-resolution multispectral images, often used for precise crop health analysis, are also widely employed in agricultural drone applications.
Types of Drone Imagery and Their Agricultural Applications
| Image Type | Resolution (Typical) | Typical Use Cases in Agriculture |
|---|---|---|
| Visible Light Imagery | 0.1-10 m/pixel | General crop health assessment, identifying stress factors like nutrient deficiency or pests, monitoring plant growth stages, and early detection of diseases. |
| Near-Infrared (NIR) Imagery | 0.1-10 m/pixel | Precisely measuring plant chlorophyll content, determining plant vigor, assessing water stress, and identifying areas with uneven crop growth. |
| Thermal Imagery | 0.1-10 m/pixel | Detecting heat anomalies in crops, identifying water stress or pest infestations, and pinpointing areas needing irrigation or pest control. |
| Multispectral Imagery | 0.1-10 m/pixel | Comprehensive assessment of crop health using multiple wavelengths of light. It helps in identifying specific nutrient deficiencies, diseases, and stress factors with greater accuracy than visible light imagery alone. |
Image Preprocessing Techniques
Drone-collected agricultural imagery, while offering valuable insights, often requires significant preprocessing to extract accurate and reliable information. This stage prepares the data for subsequent analysis, removing unwanted artifacts and enhancing the quality of the imagery. Crucial steps include noise reduction, geometric correction, and image enhancement, all contributing to more precise estimations of crop health, yield, and overall farm management.
Noise Reduction Techniques
Drone imagery frequently suffers from various noise sources, such as sensor noise, atmospheric interference, and variations in illumination. Reducing this noise is essential for accurate analysis. Common techniques include median filtering, Gaussian filtering, and wavelet denoising. Median filtering effectively removes salt-and-pepper noise, while Gaussian filtering smooths out the image, mitigating the effect of random noise. Wavelet denoising targets specific frequencies of noise, preserving the important details of the image.
The selection of the appropriate technique often depends on the specific type and characteristics of the noise present in the imagery.
Image Enhancement Techniques
Image enhancement procedures improve the overall visual quality of the drone imagery and make it more suitable for analysis. This involves boosting image contrast, highlighting subtle details, and improving the overall visual appeal, enabling more effective visual interpretation. Methods like histogram equalization and contrast stretching can improve image contrast and visibility, while gamma correction adjusts the brightness and tonal range of the image.
These techniques are crucial for identifying subtle variations in vegetation health or detecting signs of stress.
Geometric Correction and Image Registration
Drone imagery often suffers from geometric distortions due to variations in terrain elevation, sensor perspective, and flight path irregularities. Geometric correction rectifies these distortions, ensuring that the imagery aligns with a predefined coordinate system, while image registration aligns multiple images taken over different times or from different perspectives. These processes are critical for combining data from various flights and ensuring that data from different dates or angles can be compared accurately.
This accuracy is vital for monitoring crop development, identifying areas of concern, and ultimately supporting informed agricultural decisions. Sophisticated algorithms like polynomial transformations and image warping techniques are employed to correct distortions and align images.
Preprocessing Steps Summary
| Preprocessing Step | Purpose | Corresponding Algorithms |
|---|---|---|
| Noise Reduction | Removing unwanted noise from the imagery | Median filtering, Gaussian filtering, wavelet denoising |
| Image Enhancement | Improving image quality for better visual interpretation and analysis | Histogram equalization, contrast stretching, gamma correction |
| Geometric Correction | Correcting geometric distortions in the imagery | Polynomial transformations, image warping |
| Image Registration | Aligning multiple images to create a consistent dataset | Image warping techniques, feature matching |
Feature Extraction Methods
Drone-based agricultural imagery offers a wealth of data, but raw pixel information is often unwieldy. Feature extraction techniques transform this data into usable insights, enabling precise assessments of crop health and yield potential. These methods highlight key characteristics of the crops, allowing for automated analysis and targeted interventions.
Key Features Extractable from Drone Images
Drone imagery provides various data points for analysis, allowing for detailed assessments of agricultural landscapes. Key features extracted from these images can be grouped into several categories. These include spectral characteristics (related to the reflectance of light from different parts of the electromagnetic spectrum), textural attributes (referring to the spatial patterns and variations within the image), and shape or geometric properties of the crop canopy.
By extracting and analyzing these features, researchers and farmers can gain a comprehensive understanding of the health and condition of their crops.
Spectral Analysis Techniques
Spectral analysis examines the different wavelengths of light reflected or emitted by the crops. This analysis reveals valuable insights into the health and composition of the plants. Different types of vegetation reflect light differently across the spectrum. For instance, healthy crops often exhibit specific reflectance patterns that distinguish them from stressed or diseased crops. This method is crucial for identifying various stress factors, such as nutrient deficiencies or water stress, which can impact crop yields.
Analyzing these spectral signatures helps identify areas needing attention and implement timely interventions. Sophisticated algorithms can analyze spectral data, highlighting specific spectral bands indicative of different crop characteristics.
Texture Analysis Techniques
Texture analysis focuses on the spatial patterns and variations within the image. The textural properties of the crop canopy provide additional insights into its health and growth stage. For example, the texture of a healthy crop canopy will differ from that of a stressed or diseased crop. Techniques like Gray Level Co-occurrence Matrix (GLCM) are frequently used to quantify these variations.
GLCM analyses the relationship between pixels in an image, enabling the identification of textures indicative of different crop conditions. This is particularly useful in identifying early signs of disease or stress, which might not be readily apparent from visual inspection alone.
Feature Extraction for Crop Health Indicators
Different features extracted from drone images can be used to assess various crop health indicators. For instance, spectral analysis can help identify nutrient deficiencies, while texture analysis can detect early signs of stress or disease. Combining both methods offers a more comprehensive understanding of the crop’s health. By analyzing the variations in spectral reflectance and texture, it’s possible to identify and map areas where specific interventions are needed.
Discover more by delving into real-time field analysis using drone imagery in agriculture further.
Comparison of Feature Extraction Methods
| Feature Extraction Method | Description | Strengths | Weaknesses |
|---|---|---|---|
| Spectral Analysis | Analysis of reflected light across the electromagnetic spectrum | Effective in identifying stress factors like nutrient deficiencies, water stress, and disease | May not be sufficient to detect subtle variations in crop health; may be affected by atmospheric conditions |
| Texture Analysis | Analysis of spatial patterns and variations in the image | Useful in detecting early signs of stress and disease, especially when combined with spectral analysis | Requires careful selection of texture features; results can be sensitive to image resolution |
Supervised Learning Approaches
Drone-based agricultural imagery offers a wealth of data for optimizing crop management. Supervised learning algorithms, trained on labeled datasets, are crucial for extracting actionable insights from this imagery. These models learn patterns from the data to predict crop health, yield potential, and other critical parameters, ultimately improving decision-making in agriculture.
Examples of Supervised Learning Models
Various machine learning models excel at analyzing drone imagery. Support Vector Machines (SVMs) are effective at classifying different crop types or identifying diseased plants. Random Forest models, known for their robustness and accuracy, can predict crop yields with high precision. Neural networks, particularly convolutional neural networks (CNNs), have proven highly successful in image recognition tasks, such as identifying specific plant features or detecting stress indicators.
Training Supervised Learning Models with Labeled Data
Labeled data is the cornerstone of supervised learning. This data consists of images paired with corresponding labels representing the desired outcome. For example, an image of a healthy corn plant might be labeled “healthy,” while an image of a corn plant with blight might be labeled “diseased.” These labeled datasets allow the model to learn the relationships between the image features and the desired outcome.
The process involves feeding these labeled image-label pairs to the chosen algorithm, which then learns the patterns and relationships within the data. This learning process is iterative, with the model adjusting its internal parameters to minimize errors in predicting the labels for new, unseen data.
Building Predictive Models from Labeled Data
The process of building predictive models from labeled data involves several crucial steps. First, the dataset is carefully split into training, validation, and testing sets. The training set is used to train the model, the validation set is used to tune the model’s parameters, and the testing set is used to evaluate the model’s performance on unseen data.
Data preprocessing techniques, like image resizing and normalization, are often applied to improve the model’s accuracy. Feature engineering, which involves extracting relevant features from the images, can significantly enhance the predictive power of the model.
Performance Metrics for Supervised Models
Evaluating the accuracy of supervised learning models is critical. Common performance metrics include accuracy, precision, recall, and F1-score. Accuracy measures the overall correctness of the model’s predictions. Precision focuses on the proportion of correctly predicted positive instances among all predicted positive instances. Recall emphasizes the proportion of correctly predicted positive instances among all actual positive instances.
The F1-score balances precision and recall, providing a comprehensive measure of the model’s performance. A confusion matrix further visualizes the model’s performance by displaying the counts of true positives, true negatives, false positives, and false negatives.
Crop Yield Prediction Using Supervised Learning
Supervised learning can be used to predict crop yield based on drone imagery. For instance, a model trained on images of rice paddies with corresponding yield data can predict future yields based on new images. The model would analyze features like plant density, canopy cover, and nutrient levels, as extracted from the drone imagery, to make predictions. These predictions can be utilized to optimize irrigation schedules, fertilizer application, and pest control strategies, ultimately leading to higher yields and improved agricultural efficiency.
Data from multiple years and different locations are needed to develop a robust and reliable model.
Unsupervised Learning Approaches
Drone-collected agricultural imagery offers a wealth of data for optimizing crop management. Unsupervised learning techniques, particularly clustering and dimensionality reduction, play a crucial role in extracting valuable insights from this data without pre-labeled training datasets. These methods are essential for identifying patterns and structures within the imagery that might otherwise be hidden. By grouping similar data points and reducing the complexity of the data, unsupervised learning provides a foundation for understanding crop health, yield potential, and overall farm productivity.
Clustering Techniques for Crop Type Segmentation
Unsupervised clustering algorithms, such as k-means and hierarchical clustering, can effectively segment different crop types in drone imagery. These algorithms group pixels with similar spectral characteristics, which can be highly indicative of crop type. For instance, healthy wheat plants will exhibit different spectral signatures compared to diseased or stressed wheat. Identifying these clusters allows for detailed analysis of crop health and distribution across a field, facilitating targeted interventions.
Furthermore, the identification of different crop types is crucial for accurate yield estimation and resource allocation. This enables targeted application of fertilizers, pesticides, or irrigation, improving efficiency and minimizing environmental impact.
Dimensionality Reduction for Data Visualization
High-dimensional drone image data can be complex to interpret. Dimensionality reduction techniques, such as Principal Component Analysis (PCA) and t-distributed Stochastic Neighbor Embedding (t-SNE), are instrumental in simplifying this data for visualization and analysis. These methods transform the original high-dimensional data into a lower-dimensional space while preserving important relationships between the data points. This simplified representation enables researchers to visually identify patterns, clusters, and anomalies within the data.
For example, using PCA to reduce the dimensionality of a dataset allows for the creation of scatterplots that reveal correlations between different spectral bands and crop characteristics. This makes it easier to pinpoint areas of concern, such as nutrient deficiencies or pest infestations, enabling timely intervention and maximizing crop yield.
Comparison of Unsupervised Learning Methods
| Method | Description | Application in Drone Imagery | Strengths | Weaknesses |
|---|---|---|---|---|
| K-means Clustering | Partitions data into k clusters based on distance from cluster centroids. | Segmenting crops based on spectral signatures. Identifying areas of different crop types or stress levels. | Simple to implement, computationally efficient. | Requires specifying the number of clusters (k), sensitive to initial centroid placement, may not perform well with non-spherical clusters. |
| Hierarchical Clustering | Builds a hierarchy of clusters based on similarity measures. | Grouping pixels based on spectral similarity, identifying relationships between different crop types. | Can handle various cluster shapes, provides a hierarchical view of data. | Computationally more intensive than k-means, may be challenging with large datasets. |
| Principal Component Analysis (PCA) | Transforms data into a new coordinate system where the first few principal components capture most of the variance. | Reducing the dimensionality of spectral data for visualization. Identifying key spectral features associated with crop health. | Effective for data visualization, highlights important features. | Assumes linear relationships between variables, may lose some information during dimensionality reduction. |
| t-distributed Stochastic Neighbor Embedding (t-SNE) | Preserves local neighborhood relationships in the data while reducing dimensionality. | Visualizing high-dimensional spectral data in 2D or 3D space. Identifying clusters or anomalies in complex spectral data. | Effective for visualizing complex, non-linear relationships. | Computationally intensive, may not be suitable for extremely large datasets. |
Deep Learning Techniques
Deep learning, a subset of machine learning, is rapidly transforming agricultural practices, offering unprecedented precision in analyzing drone-collected imagery. This sophisticated approach leverages artificial neural networks with multiple layers to identify complex patterns and relationships within images, ultimately enabling more accurate and efficient crop management. Its ability to learn intricate details and subtle variations in images makes it a powerful tool for identifying issues like disease, stress, or nutrient deficiencies early on.
Convolutional Neural Networks (CNNs) for Image Analysis
Convolutional Neural Networks (CNNs) are a specialized type of deep learning architecture particularly well-suited for image analysis. Their unique design allows them to extract hierarchical features from images, progressing from basic edges and textures to increasingly complex patterns and objects. This hierarchical feature extraction is crucial for recognizing subtle variations in crop health.
Training CNNs to Recognize Crop Characteristics
Training CNNs to identify specific crop characteristics involves feeding the model vast datasets of drone images, paired with corresponding information about the crops. These datasets often include images of healthy and unhealthy crops, along with details like crop type, stage of growth, and any visible issues. The model learns to associate specific visual patterns with particular characteristics, ultimately enabling it to accurately classify and diagnose various crop conditions.
This process involves adjusting the model’s internal parameters to minimize errors in its predictions. Sophisticated optimization techniques, like backpropagation, are crucial in this training phase. Examples of crop characteristics include identifying signs of nutrient deficiencies, stress, or disease by detecting subtle color variations, leaf shapes, and growth patterns.
Case Study: Early Detection of Crop Stress
A case study in the Midwest demonstrates the effectiveness of deep learning in early detection of crop stress. Researchers used a CNN trained on a dataset of drone images encompassing various field conditions, including healthy and stressed corn crops. The dataset included images of the same field at different times, capturing changes in crop appearance over a growing season.
This comprehensive dataset allowed the model to learn the subtle changes that signaled early stages of stress. The results showcased the ability of the model to detect stress symptoms up to 7 days before they were visually apparent to human observers. This early warning system enabled farmers to implement preventative measures like irrigation adjustments or fertilizer applications, resulting in substantial yield increases and reduced economic losses.
The CNN achieved an accuracy of 92% in identifying stressed crops, demonstrating its potential to improve crop management strategies.
Data Integration and Analysis

Agricultural drone imagery is increasingly valuable, but its full potential is unlocked by integrating it with other data sources. This holistic approach allows for a more nuanced understanding of crop health and performance, moving beyond simple visual assessments. By combining drone imagery with meteorological data, soil characteristics, and historical yield records, researchers and farmers can develop comprehensive models for predicting crop outcomes and optimizing agricultural practices.Combining drone imagery with other data sources provides a richer dataset for analysis.
This integrated approach allows for a more detailed understanding of the factors influencing crop health and yield. The resulting models can offer insights into the complex interactions between environmental conditions, soil properties, and crop management strategies.
Integration with Weather Data
Weather patterns significantly impact crop growth. Integrating drone imagery with weather data allows for a more comprehensive understanding of how environmental conditions affect crop health. For instance, by correlating drone-captured images of stressed crops with rainfall records and temperature data, researchers can identify the precise impact of drought or excessive heat on different crop types. This refined analysis can inform irrigation strategies and predict potential yield losses, providing valuable insights for farmers.
Integration with Soil Data
Soil properties play a crucial role in determining crop yield. Integrating drone imagery with soil data provides a more comprehensive view of the interplay between soil characteristics and crop development. For example, soil nutrient maps can be overlaid with drone-captured images to identify areas where nutrient deficiencies might be impacting crop growth. This combined analysis allows for more targeted fertilizer application, improving resource efficiency and crop yield.
Integration with Historical Yield Data
Historical yield data provides crucial context for understanding long-term trends and patterns in crop production. Integrating drone imagery with historical yield data can help to identify correlations between visual indicators in drone imagery and past yield performance. This can allow for more accurate predictions of future yields, enabling farmers to make informed decisions about planting, fertilization, and irrigation strategies.
For example, comparing drone-captured images of current crop health with past yield data from similar conditions can help predict potential yield levels.
Building Comprehensive Crop Models
The integration of diverse data sources, including drone imagery, weather data, soil data, and historical yield data, allows for the construction of sophisticated crop models. These models can predict potential yield losses due to stress factors like drought or pest infestations. Using predictive models, farmers can proactively implement strategies to mitigate these issues. This allows for better resource allocation, optimized management practices, and ultimately, increased yields.
“Data validation and quality control are paramount in agricultural image analysis. Inaccurate or inconsistent data can lead to misleading results and ineffective management strategies.”
Data Validation and Quality Control
Ensuring the accuracy and reliability of the integrated data is crucial for the validity of crop models. Rigorous validation procedures, including ground truthing and comparison with existing data sets, are necessary to guarantee the quality of the analyzed information. This process helps to identify and correct potential errors in the data collection, processing, and analysis stages.
Case Studies and Applications
Drone imagery analysis is revolutionizing agricultural practices, offering unprecedented insights into crop health and yields. By providing high-resolution, detailed views of vast fields, drones enable farmers and agricultural researchers to pinpoint areas needing attention, optimize resource allocation, and ultimately enhance overall efficiency and profitability. This detailed approach is particularly valuable in large-scale farming operations where timely intervention is crucial for maximizing crop output.
Real-World Application: Precision Irrigation
Drone-based imagery, coupled with sophisticated image analysis techniques, can precisely identify areas of a field experiencing water stress. This information allows for targeted irrigation, preventing over-watering in some areas while ensuring adequate hydration in others. The result is optimized water use, reduced water waste, and improved crop health, leading to higher yields. For instance, in a recent study of citrus orchards, drones equipped with multispectral sensors identified specific tree locations exhibiting signs of water deficit.
This data was then used to adjust irrigation schedules, leading to a 15% increase in fruit yield compared to traditional irrigation methods.
Practical Applications in Various Settings
Drone imagery analysis is proving effective across a wide range of agricultural settings. In vineyards, it helps monitor the health of individual vines, enabling early detection of diseases or nutrient deficiencies. In orchards, it allows for precise pest management, targeting treatments only to areas with infestations, thereby minimizing pesticide use and environmental impact. These applications highlight the adaptability and versatility of this technology.
Specific Application: Enhancing Crop Management
One compelling application is the early detection of crop stress. By analyzing drone imagery that captures subtle variations in vegetation, such as changes in color or texture, researchers can identify stress factors like nutrient deficiencies, water stress, or pest infestations early on. This allows farmers to implement timely interventions, such as applying fertilizers or adjusting irrigation schedules, which can significantly improve crop health and yield.
For example, a farmer using this technology noticed a discoloration in a section of their soybean field, which was later confirmed as a nutrient deficiency. By applying targeted fertilizer to that specific area, the farmer was able to maintain optimal crop growth and yield.
Table of Use Cases
| Use Case | Region | Crop Type |
|---|---|---|
| Precision Irrigation | Mediterranean, California | Citrus, Grapes |
| Pest and Disease Detection | Midwest US, Europe | Soybeans, Corn, Wheat |
| Nutrient Management | Southeast Asia, South America | Rice, Coffee |
| Yield Prediction | Australia, North America | Cotton, Wheat, Soybeans |
Final Conclusion
In conclusion, data analysis techniques for drone-collected agricultural images offer a powerful toolkit for modern agriculture. By leveraging the rich data generated by drones, farmers and researchers can gain unprecedented insights into crop health, predict yields, and ultimately optimize crop management. The diverse methods discussed, from preprocessing to deep learning, highlight the growing potential of this technology in addressing critical challenges in global food production.
Future applications promise even more sophisticated analysis and improved decision-making in the agricultural sector.